This article describes how to integrate Autochartist into ChartIQ
To get up and running quickly, here is an
Angular Demo Application Source Code Download that uses the
Autochartist Trading Opportunities API
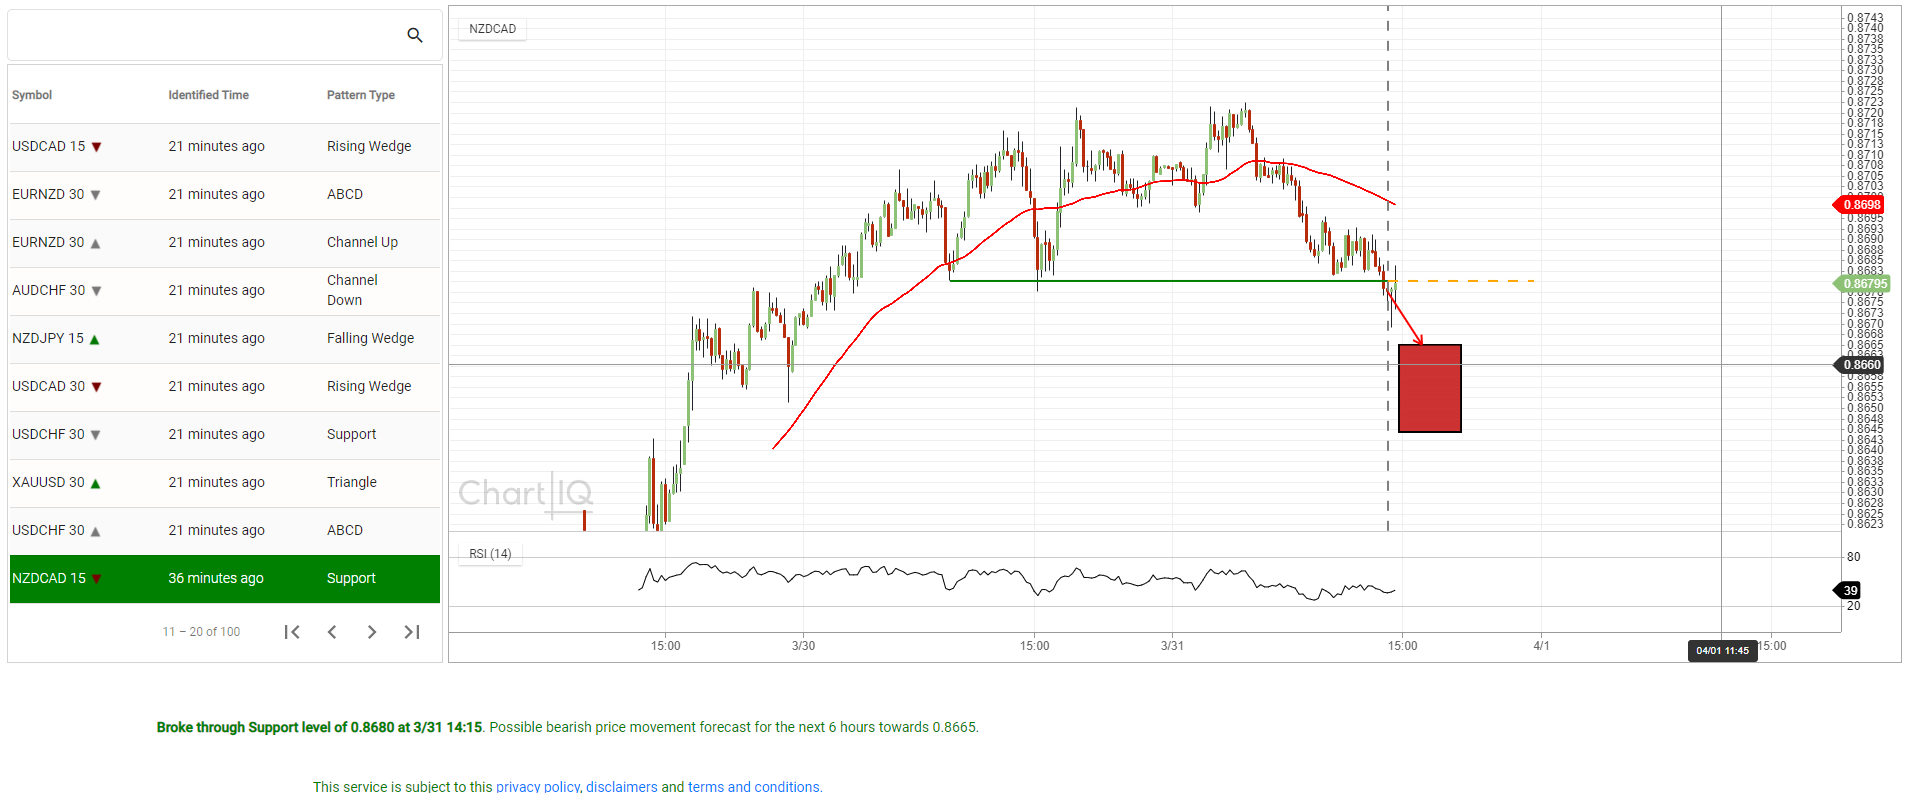
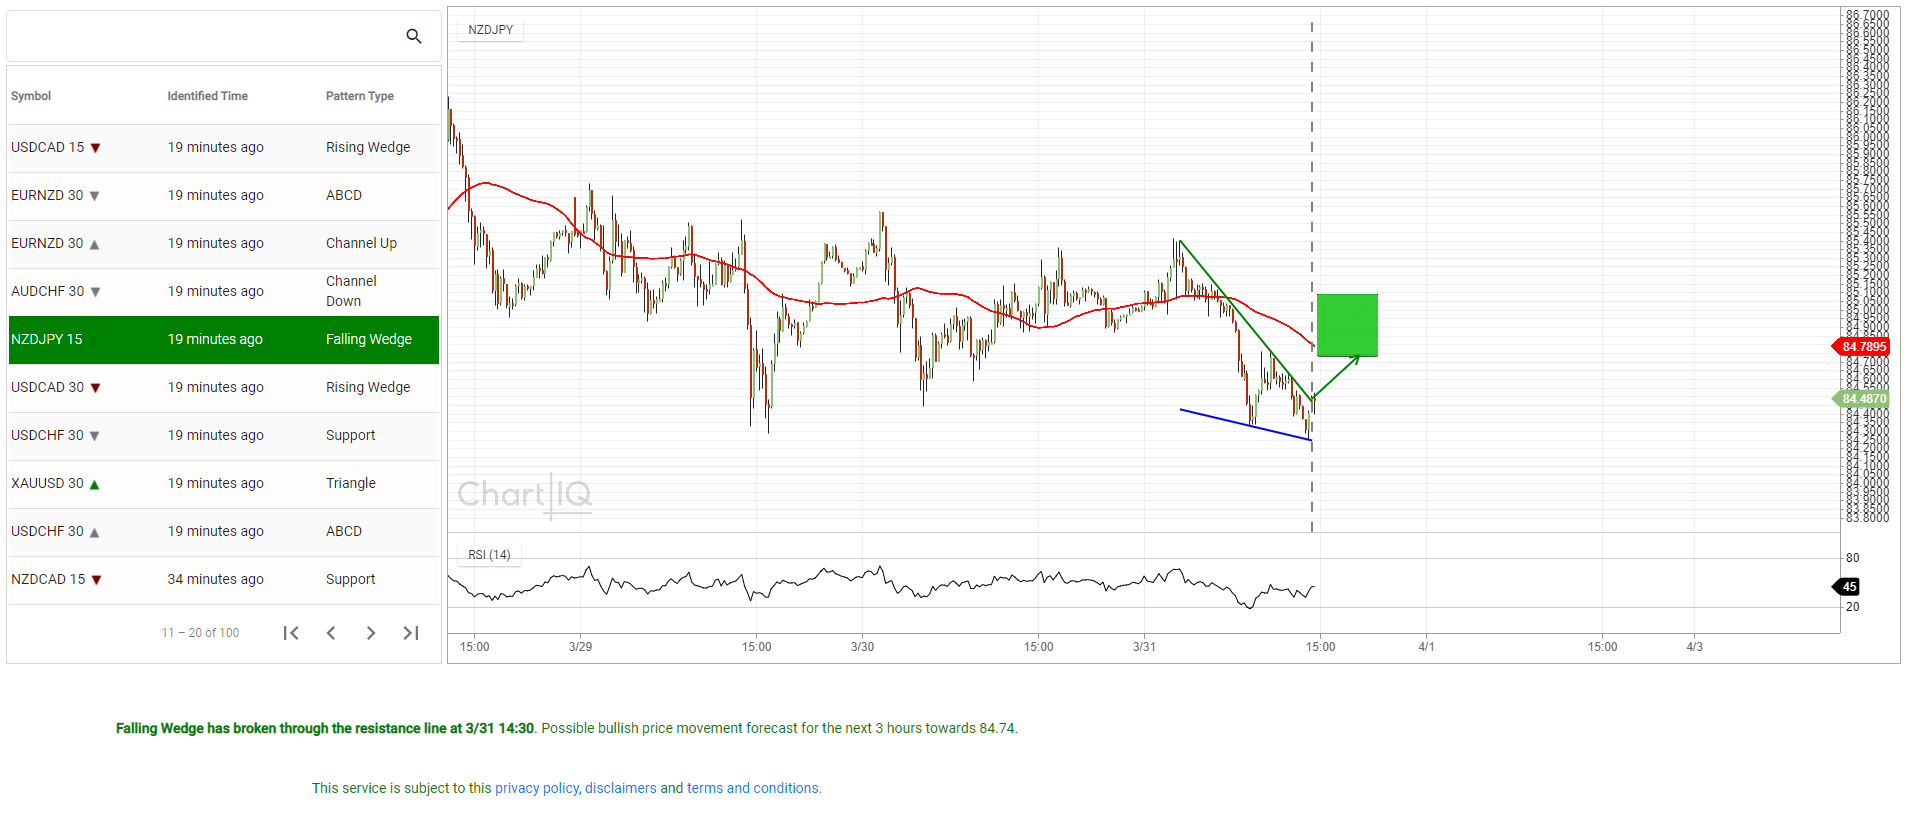
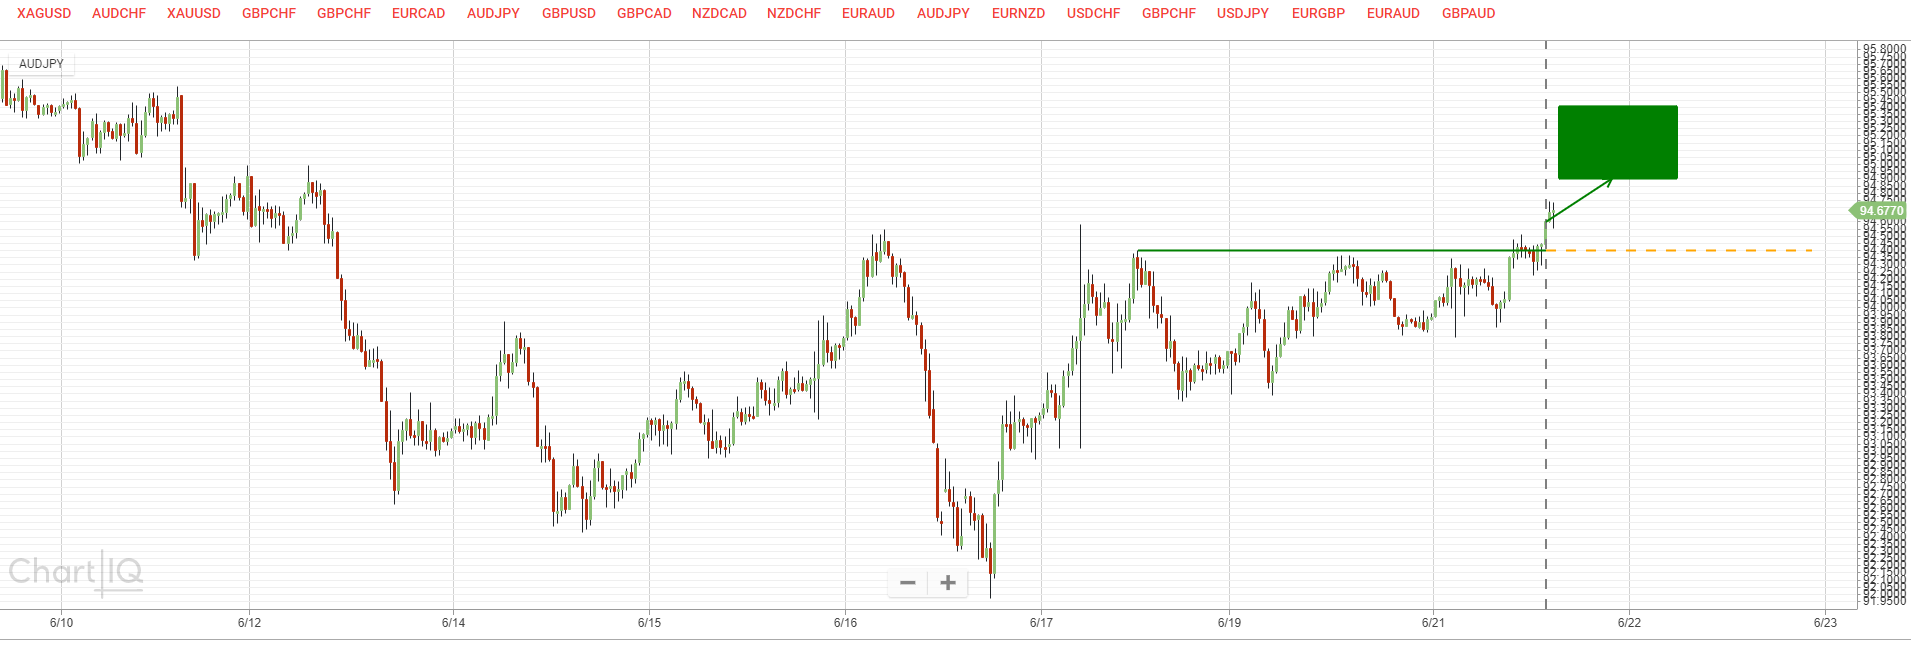
Chart patterns and key levels are drawn onto a ChartIQ chart using the
Autochartist NodeJS-based Pattern Drawing Library
Autochartist ChartIQ Demo
Overview
This project contains a simple demonstration of drawing Autochartist patterns using the ChartIQ library.
It depends on
Angular v12,
ChartIQ v8.9.2 and
Autochartist Trading Opportunities
Using the drawing library in your ChartIQ project
- Build/install
– Install the ChartIQ library
- Obtain a copy of the library, and extract the archive (.tgz file)
- Copy the tarball (chartiq-x.x.x.tgz) to your project folder
Note: The folder must contain a package.json file.
Install the library from the tarball using npm, for example:
'npm install ./chartiq-x.x.x.tgz'
– Install the Autochartist Drawing library
- Download the drawing library, and extract the archive (.zip file)
- Copy the zip file (drawing-lib-x.x.x.zip) to your project folder
Install the library using npm, for example:
'npm install ./drawing-lib-x.x.x.zip'
Now install the rest of the dependencies with
'npm install'
Now all the necessary node modules for the Angular project that have been specified in the package.json configuration file should be installed.
- Run locally
To run locally build angular and run 'ng serve'. You can then access your frontend on :
http://localhost:4200/to-chartiq/?broker_id=?&account_type=?&user=?&token=? or
http://localhost:4200/to-chartiq/symbols?broker_id=?&account_type=?&user=?&token=?
Please note that you need to pass in the correct values of your Autochartist broker parameters (broker_id, account_type, user, token).
Please see
more information about the security token here.
To add custom colors to drawing or use the Dark or Light theme colors, pass it to createDrawing function in the example:
let colors = {
  chartPattern: {
    predictionRectangle: {
      colorBullish: 'green',
      colorBearish: 'red',
      pattern: 'solid',
      lineWidth: 2,
      opacity: 3
    },
    supportLine: {
      color: 'blue',
      pattern: 'solid',
      lineWidth: 2,
      opacity: 3,
    },
    resistanceLine: {
      color: 'green',
      pattern: 'solid',
      lineWidth: 2,
      opacity: 3
    },
    eventLine: {
      color: 'grey',
      pattern: 'dashed',
      lineWidth: 2,
      opacity: 0
    },
    supportLineForecast: {
      color: 'yellow',
      pattern: 'dashed',
      lineWidth: 2,
      opacity: 0
    },
    resistanceLineForecast: {
      color: 'yellow',
      pattern: 'dashed',
      lineWidth: 2,
      opacity: 0
    },
    arrow: {
      arrowLine: 'grey',
      arrowTips: 'grey',
      arrowTipsBullish: 'green',
      arrowTipsBearish: 'red',
      arrowLineBullish: 'green',
      arrowLineBearish: 'red',
      pattern: 'solid',
      lineWidth: 2,
      opacity: 0
    }
  },
  keyLevel: {
    predictionRectangle: {
      colorBullish: 'green',
      colorBearish: 'red',
      pattern: 'solid',
      lineWidth: 2,
      opacity: 3
    },
    eventLine: {
      color: 'grey',
      pattern: 'dashed',
      lineWidth: 2,
      opacity: 0
    },
    forecastLine: {
      color: 'orange',
      pattern: 'dashed',
      lineWidth: 2
    },
    keyLevelLine: {
      color: 'green',
      pattern: 'solid',
      lineWidth: 2
    },
    arrow: {
      arrowLine: 'grey',
      arrowTips: 'grey',
      arrowTipsBullish: 'green',
      arrowTipsBearish: 'red',
      arrowLineBullish: 'green',
      arrowLineBearish: 'red',
      pattern: 'solid',
      lineWidth: 2,
      opacity: 0
    }
  },
  consecutiveCandles: {
    arrow: {
      arrowLine: 'grey',
      arrowTips: 'grey',
      arrowTipsBullish: 'green',
      arrowTipsBearish: 'red',
      arrowLineBullish: 'green',
      arrowLineBearish: 'red',
      pattern: 'solid',
      lineWidth: 2,
      opacity: 0
    },
    lines: {
      colorBullish: 'green',
      colorBearish: 'red',
      pattern: 'solid',
      lineWidth: 2,
      opacity: 0
    }
  },
  fibonacci: {
    textColor: 'black',
    predictionAreaColor: 'grey',
    fibonacciLinesColor: 'green',
    predictionLastLineTextColor: 'grey',
    predictionArea: {
      colorEmerging: 'green',
      color: 'grey',
      lineWidth: 2
    },
    lines: {
      color: 'blue',
      pattern: 'solid',
      lineWidth: 2
    },
    eventLine: {
      color: 'grey',
      pattern: 'solid',
      lineWidth: 2
    },
    arrow: {
      arrowLine: 'grey',
      arrowTips: 'grey',
      arrowTipsBullish: 'green',
      arrowTipsBearish: 'red',
      arrowLineBullish: 'green',
      arrowLineBearish: 'red',
      pattern: 'solid',
      lineWidth: 2,
      opacity: 0
    },
  },
  bigMovement: {
    lines: {
      colorBullish: 'green',
      colorBearish: 'red',
      pattern: 'solid',
      lineWidth: 2,
      opacity: 0
    },
    eventLine: {
      color: 'grey',
      pattern: 'solid',
      lineWidth: 2,
      opacity: 0
    }
  }
}
let theme = {Dark: 'dark', Light: 'light'};
The steps required to implement in the application are as follows:
1. Fetch table data from the TO api
2. On select of table row, get drawing-data link from the symbol links and fetch the drawData:
    {
        "rel": "drawing-data",
        "href": "<a href="https://component.autochartist.com/to/resources/results/detail/drawing-data/">https://component.autochartist.com/to/resources/results/detail/drawing-data/</a>..."
    },
3. Once drawData has been received, initialize the call to display the chart:
    this.chartService.displayChart;
4. Create chart as normal, with the settings you want and attach your feed:
    The demo feed we are using: <a href="https://component.autochartist.com/to/resources/pricing/pricegraph">https://component.autochartist.com/to/resources/pricing/pricegraph</a> with the provided url params.
5. When loadChart function is called, the drawings library is added:
    this.ciq.loadChart(drawData.symbol, {
      periodicity: {
        period: 1,
        interval: drawData.interval,
        timeUnit: 'minute'
      }
    }, function () {
      this.remove('draw')
      this.clearDrawings(true, true)
      this.append('draw', createDrawing)
      this.draw()
      this.home({whitespace: 300})
      function createDrawing() {
        new ACDrawings.createDrawing(drawData, CIQ, this, colors, theme.LIGHT)
      }