Non-trending patterns capitalize on confusion and lack of opinion.
Non-trending patterns capitalize on confusion and lack of opinion. A trending market shows an imbalance between buyers and sellers, and a sideways market reveals the balance between supply and demand.
Traders should wait for a shift in balance to find a set up for non-trending patterns. The shift will be traded as prices pierce the support or resistance lines of patterns such as triangles and rectangles. Traders should also determine whether the market is in a distribution or accumulation cycle as there are two potential entry scenarios for non- trending patterns.
There are some simple cues to focus on to quickly determine the likelihood of a momentum entry versus a distribution fade entry.
First and foremost must be the chart pattern itself. Distribution fade entries rely on a horizontal support or resistance line for the short off the ceiling or buy off the floor. This means that rectangles, as well as ascending and descending triangles are patterns that could set up in a distribution market cycle, and therefore be potential fade set ups.
The initial trend reading for this set up ideally should be 1 – 5 bars. If the reading is low (1 – 3 bars) the initial trend is indicating an accumulation set up. If the initial trend reading is 4 – 5 bars, the underlying market cycle is most likely in distribution. If the reading is higher than 6 bars the market is trending.
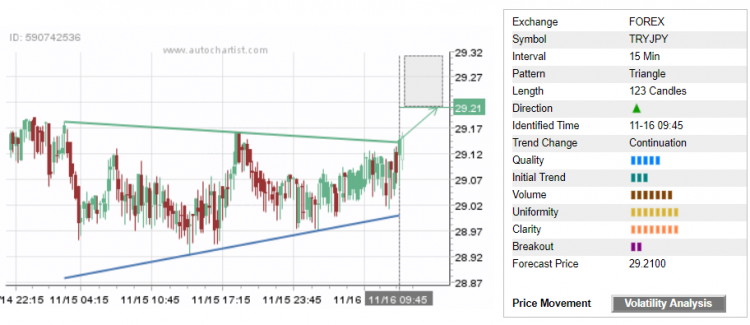
The resistance line is slightly angled downwards but the overall level is horizontal. The pattern is therefore an ascending triangle as the horizontal resistance level, and the uptrend support line form the chart pattern.
Note the 3-bar initial trend reading. It is high enough to signal a potential distribution cycle. This suggests that prices are more likely to exhaust at the pattern’s resistance level than follow-through higher. The Breakout reading is very low. This also suggests less potential for an upside follow-through.
This level could be shorted. All Autochartist Inside the Range entries (A.I.R.) are aggressive set ups, and the validity of the short extends only 10 to 12 pips beyond the highest point of the ceiling. This way should there be momentum beyond the ceiling, an aggressive fade can be reversed and the momentum bought.
A more conservative entry for all consolidation and congestion patterns is to anticipate and react to the momentum that triggers as prices break through the support or resistance of a sideways pattern. This is an accumulation cycle set up, and is ideal for markets where the volatility is low and the range narrower. This cycle is identified by a 1 – 3 bar initial trend reading.
Traders could think of this set up as being a “coiled spring” ready to release. As the spring coils it stores energy until it unloads. The more it is compressed, the more potential energy is on the release. This is how accumulation markets work. Coiled springs can store short term energy. Examples can be seen with the energy contained within narrow range candles like Dojis; or even within the candles themselves, like Haramis.
When energy is stored over the course of multiple candles in a triangle or pennant, the eventual release could come with significant momentum.
Momentum set ups must be traded in an unbiased way. This means that traders should anticipate a break in either direction since there is no trend. The confirmation of an accumulation cycle is the low initial trend reading. Visually it is ideal to see a narrowing range in the price action.
Triangles and pennants by their very nature are self-limiting patterns. If prices do nothing else but move sideways within the pattern, they will eventually run out of room. The area where the pattern narrows to squeeze prices tighter and tighter is the area where the breakout or breakdown is nearing. A simple indicator like a MACD Histogram could be used as a directional filter for the break.
Remember the coiled spring: If prices break too early within the triangle there is a chance that the market may be in distribution. The coiled spring works for rectangle patterns too. Even though rectangles, as well as double and triple tops and bottoms, are parallel and/or horizontal line patterns, the range of the pattern can show how much potential energy the coiled spring is storing.
Narrow ranges work very well for momentum breakouts and breakdowns. While wider ranges are more suitable for distribution fades. Again, be sure to check, not only the initial trend but the actual range of the chart pattern to see if there is a spring being coiled.