Chart Patterns
Emerging Patterns Arrow
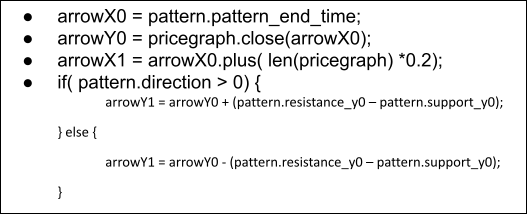
- Let arrowX0 be the pattern_end_time[1] of the pattern.
- Let arrowY0 be the close-value of candle at pattern_end_time.
- Let arrowX1 be the value of arrowX0 + (pricegraph[2] length * 0.2).
- If direction[3] > 0, then let arrowY1 be arrowY0 + (resistance_y0[4] - support_y0[5]), otherwise let arrowY1 be arrowY0 - (resistance_y0 - support_y0).
Example sudo-code:
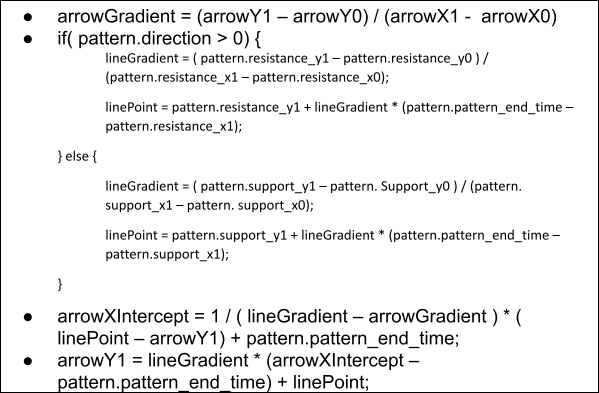
Next we need to calculate where the arrow intersects on the resistance or support line:
- Let arrowGradient be (arrowY1 – arrowY0) / (arrowX1 – arrowX0).
- If direction > 0, then let lineGradient be (resistance_y1 - resistance_y0) / (resistance_x1 - resistance_x0), otherwise let lineGradient be (support_y1 - support_y0) / (support_x1 - support_x0).
- If direction > 0 then let linePoint be resistance_y1 + lineGradient * (pattern_end_time - resistance_x1), otherwise let linePoint be support_y1 + lineGradient * (pattern_end_time - support_x1).
- Let arrowXIntercept be 1 / (lineGradient - arrowGradient) * (linePoint - arrowY1) + pattern_end_time.
- Let arrowY1 be lineGradient * (arrowXIntercept – pattern_end_time) + linePoint.
Example sudo-code:
The arrow is then drawn from (arrowX0,arrowY0) to (arrowXIntercept,arrowY1)
[6]
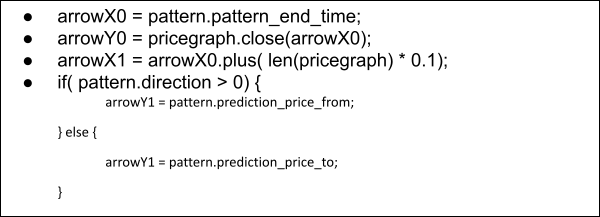
Completed Patterns Arrow
- Let arrowX0 be pattern_end_time.
- Let arrowY0 be the close-value of the candle at pattern_end_time
- Let arrowX1 be arrowX0 + (pricegraph length * 0.1).
- If direction > 0 then let arrowY1 be the prediction_price_from[7], else let arrowY1 be the prediction_price_to[8]
Example sudo-code:

The arrow is then drawn from (arrowX0,arrowY0) to (arrowX1,arrowY1)
[9]
Completed Patterns Prediction Area
- Let predictionTime be pattern_end_time + pattern_length.
- If the predictionTime is greater than the pricegraph length, then let predictionTime be pricegraph_length * 1.1.
- Draw rectangle as (pattern_end_time + 5 pixels, prediction_price_from, prediction_price_to, predictionTime) [10]
Key Levels
Emerging Patterns Arrow
- Let arrowX0 be the pattern_end_time of the pattern.
- Let arrowY0 be the close-value of candle at pattern_end_time.
- Let arrowX1 be the value of arrowX0 + (pricegraph length * 0.05).
- Let arrowY1 be the value of pattern_price[11]
- The arrow is then drawn from (arrowX0,arrowY0) to (arrowX1,arrowY1)[12]
Completed Patterns Arrow
- Let arrowX0 be the pattern_end_time.
- Let arrowY0 be the close of candle at pattern_end_time.
- Let arrowX1 be arrowX0 + (pricegraph length * 0.1).
- If direction > 0 then let arrowY1 be prediction_price_from, else let arrowY1 be prediction_price_to.
- The arrow is then drawn from (arrowX0,arrowY0) to (arrowX1,arrowY1)[13]
Example sudo-code:
Completed Patterns Prediction Area
Let predictionTime be pattern_end_time + pattern_length.If the predictionTime is greater than the pricegraph length, then let predictionTime be pricegraph_length * 1.1.Draw rectangle as (pattern_end_time + 5 pixels, prediction_price_from, prediction_price_to, predictionTime)
[14]
Appendix A
API Terminology
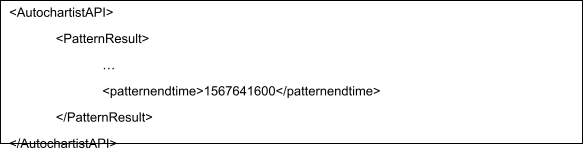
Pattern_end_time
The pattern end time can be found in all pattern results.
In the XML API it will appear as the following:
In the json API it will appear as the following:

Price Graph
For the purpose of displaying the pattern, the Price Graph comprises the candle list 20 candles before the start of the pattern, up to and including the candle at the end of the pattern.
Direction
The Direction can be found in all pattern results. A direction of 1 means the pattern is bullish, a value of -1 means the batter is bearish.
In the XML API it will appear as the following:
In the json API it will appear as the following:

Resistance_Y0
The Resistance_Y0 value can be found in all pattern results, but it is better to calculate the value based on the pricegraph data being used.
To calculate the value, extract the UNIX timestamp value of resistance_x0 from the API.
In the XML API it will appear as the following:
In the json API it will appear as the following (the value will have to be converted to a UNIX timestamp):

Next determine the high-value of the candle at resistance_x0, this will be used as resistance_y0.
Support_Y0
Apply point 1.4 to the support_Y0, only using the support-values instead.
Prediction_Price_From
The prediction_price_from value can be found in completed pattern results only.
In the XML API it will appear as the following:
In the json API it will appear like this:

Prediction_Price_To
In the XML API it will appear as the following:

In the json API it will appear as the following:

Pattern_Price
In the json API it will appear as the following:

Appendix B – Images
Images 1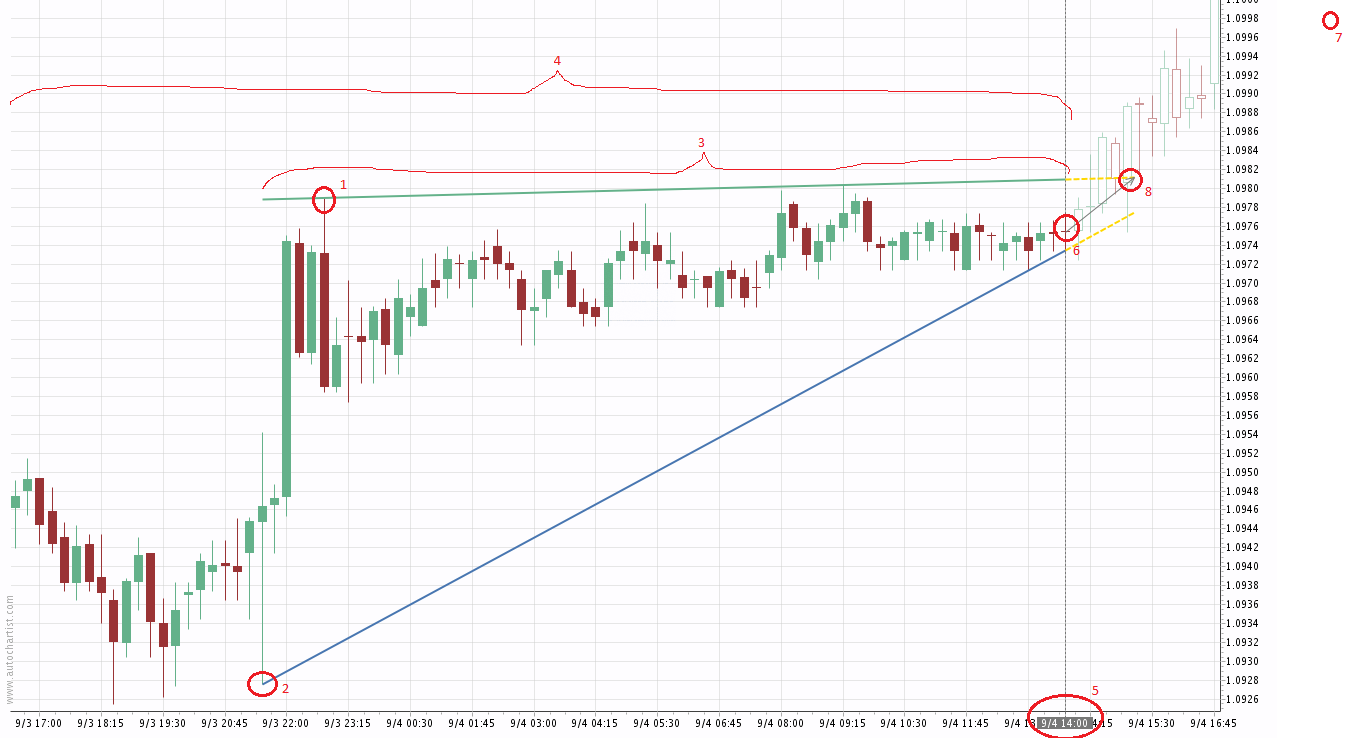
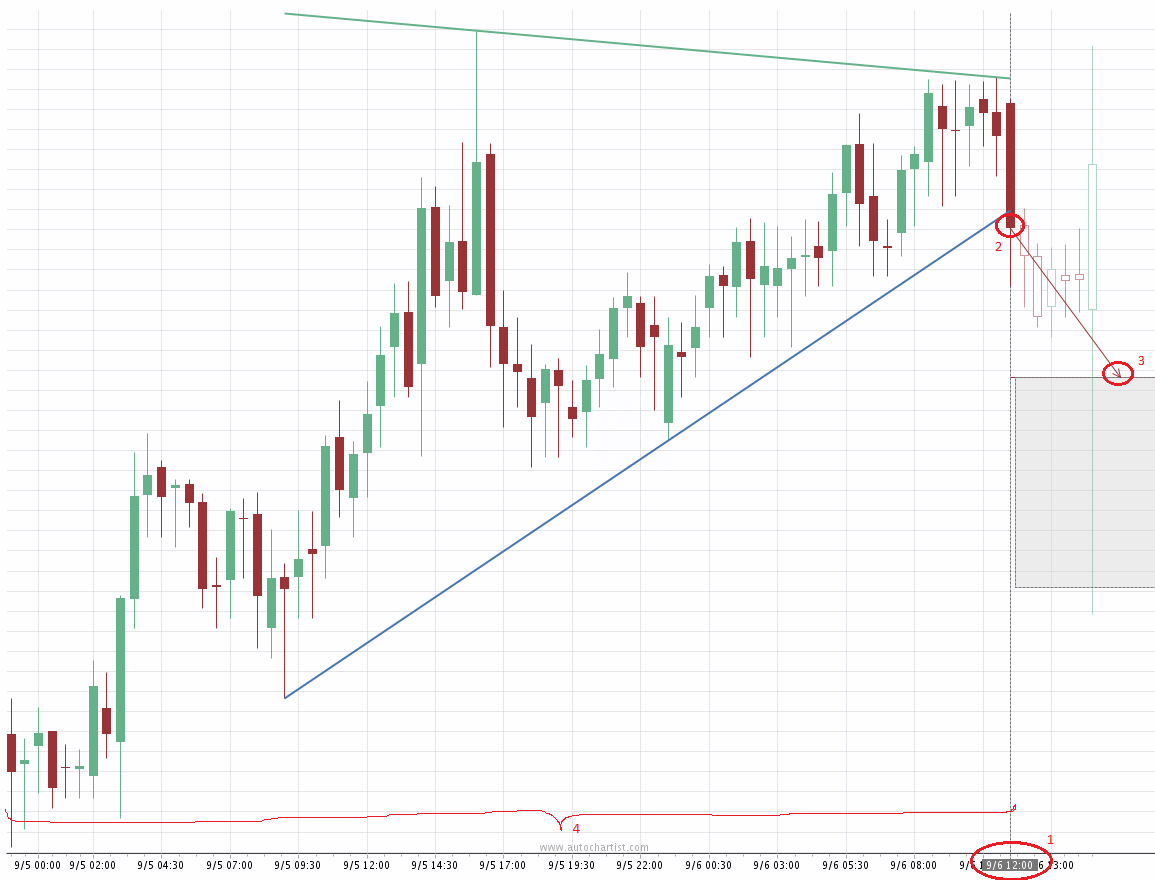
This represents the point resistance_x0, resistance_y0.This represents the point support_x0, support_y0.This is the pattern lengthThis is the pricegraph length at the time the pattern was identified.This represents the pattern_end_time time.This represents the calculated point arrowX0, arrowY0.This represents the calculated point arrowX1, arrowY1
[15].This represents the calculated point arrowXIntercept, arrowY1.
Images 2
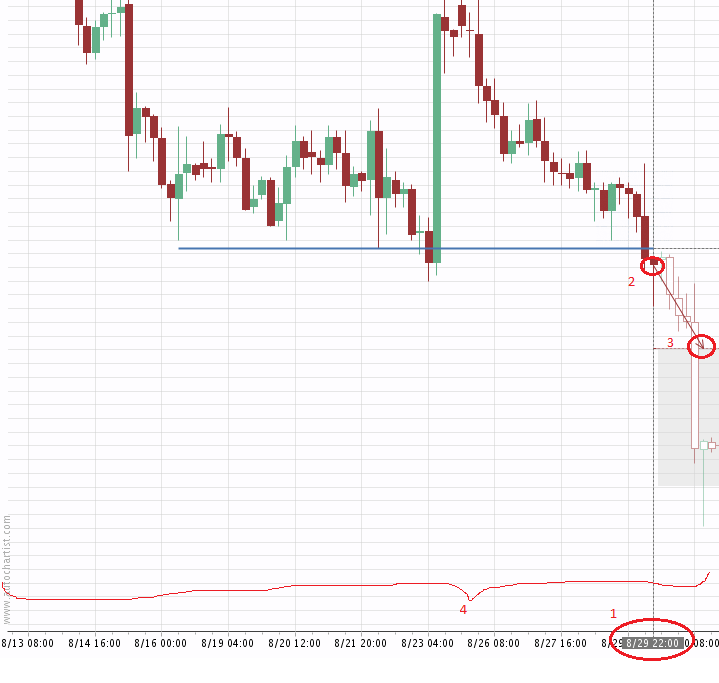
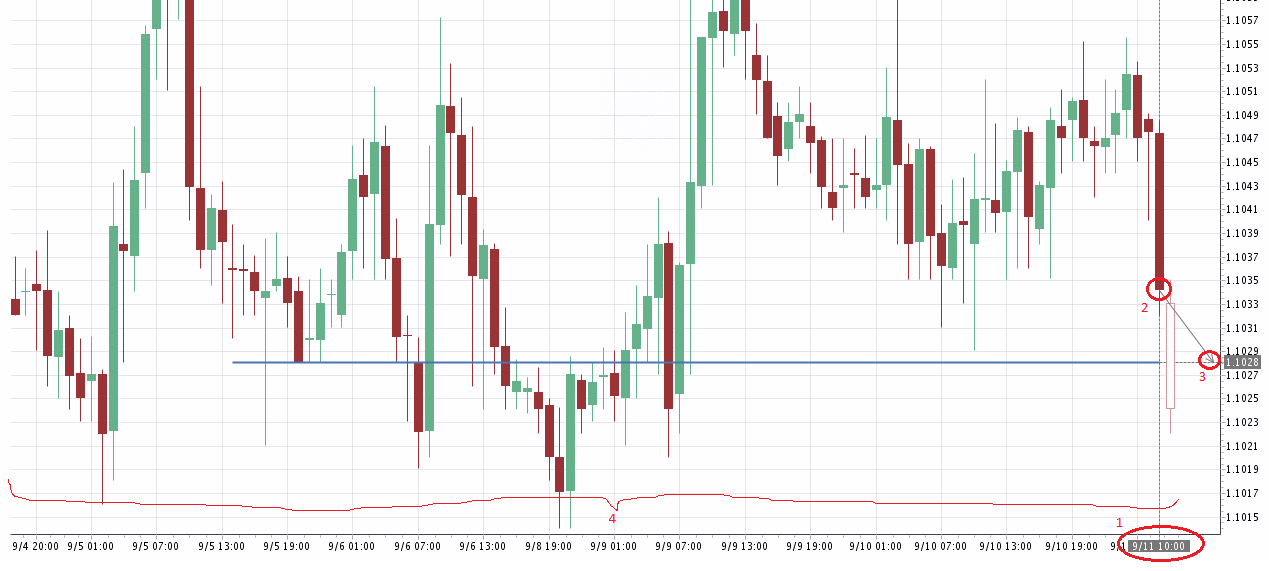
This represents the pattern_end_time time.This represents the calculated point arrowX0, arrowY0.This represents the calculated point arrowX1, arrowY1.This is the pricegraph length at the time the pattern was identified.
Images 3
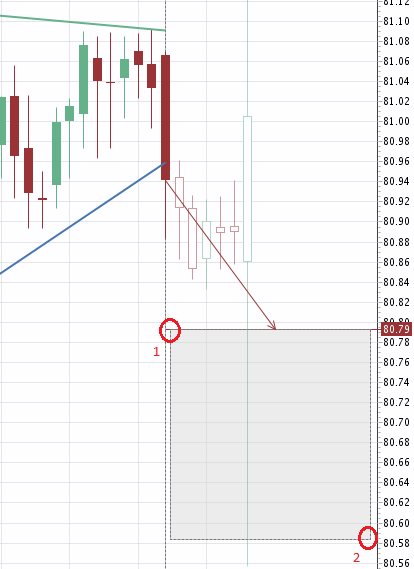
This represents the point (pattern.pattern_end_time + 5 pixels, pattern.prediction_price_to)This represents the point (pricegraph_length * 1.1, pattern.prediction_price_from)
Images 4
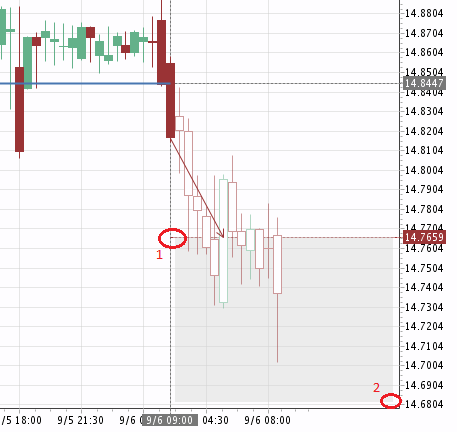
This represents the pattern_end_time time.This represents the calculated point arrowX0, arrowY0.This represents the calculated point arrowX1, arrowY1.This is the pricegraph length at the time the pattern was identified.
Images 5
This represents the point (pattern.pattern_end_time + 5 pixels, pattern.prediction_price_to)This represents the point (pricegraph_length * 1.1, pattern.prediction_price_from)
Images 6
This represents the pattern_end_time time.This represents the calculated point arrowX0, arrowY0.This represents the calculated point arrowX1, arrowY1.This is the pricegraph length at the time the pattern was identified.
[1] See Appendix A-1.1 for terminology
[2] See Appendix A-1.2 for terminology
[3] See Appendix A-1.3 for terminology
[4] See Appendix A-1.4 for terminology
[5] See Appendix A-1.5 for terminology
[6] See Appendix B - Image 1
[7] See Appendix A-1.6 for terminology
[8] See Appendix A-1.7 for terminology
[9] See Appendix B – Image 2
[10] See Appendix B – Image 3
[11] See Appendix A – 1.8 for terminology
[12] See Appendix B - Image 6
[13] See Appendix B – Image 4
[14] See Appendix B – Image 5
[15] Point arrowX1, arrowY1 may not represent actual values, but are shown for display purposes only.