There are historical tendencies which dictate whether a chart pattern is generally considered to be a continuation or reversal pattern.
There are historical tendencies which dictate whether a chart pattern is generally considered to be a continuation or reversal pattern. These tendencies should however not override a break in the pattern which would be contrary to what the historical tendency is.
Results identified by Autochartist mostly define the trend of a chart pattern. While this column heading trend offers insight into the most likely direction of the break, there are other considerations to keep in mind before setting up a trade.
Q: What are continuation and reversal patterns? And how can you use Autochartist to trade both these patterns?
A: Continuation and reversal patterns in essence do exactly what their names imply. A continuation pattern forms and then breaks in the direction of the trend that it
developed within. A reversal pattern breaks in the opposite direction of the trend it developed within.
An important quality measure of a chart pattern is the trend that precedes it. It is irrelevant whether the trend is classified as being bullish or bearish. It is merely the consistency and duration of the initial trend which contributes to determining the “quality” and aesthetics of the pattern.
Always remember that the name of the chart pattern (continuation or reversal) implies what the pattern is likely to do and not what it will do.
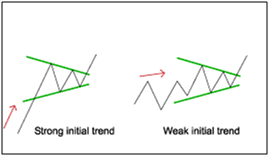
A lot of merit of a continuation or reversal tendency of a chart pattern emanates from the initial trend. Therefore, when traders observe the Autochartist column headings, both the “trend” as well as the “initial trend” readings should be looked at to validate the patterns directional follow-through.
Below is a visual of how a strong initial trend looks compared to a weak initial trend:
The overall “Quality” of any chart pattern determined by both Autochartist, and the aesthetics of the pattern observed by traders, must be validated by the results or readings of all of the column headings to achieve effective and consistent results. A reminder that these include: “Length”, “Uniformity”, and “Clarity”.
Another helpful tool available to traders to better trade any chart pattern is to confirm the pattern break with an indicator.
There are many oscillator studies which can help to confirm trades. To mention a few:
• Stochastic
• MACD Histogram
• RSI
• Or CCI for secondary confirmation.
The primary confirmation which is the trading trigger itself, must originate from price and charting patterns. Furthermore, certain patterns like double and triple tops/bottoms can be traded within the chart pattern and not only as breakouts or breakdowns.
Any good trading tool will assist traders to determine the best course of action. A great tool will leave room for flexibility and allow traders to venture beyond the confines of historical tendencies.
Autochartist encompasses both factors of determining the best course of action but still leaving room for flexibility.